Happily HEVA After: A new value add framework for higher education
Getting into university is not the same as getting your happily ever after from it. In the latest of our policy signals, Antony Moss introduces HEVA, a value-add index that looks at universities not by what their graduates earn, but by whether students from free-school-meal backgrounds who start a degree finish it, and finish it well, and he sets out what would be necessary for us to have this data for the whole English HE system.
Date:
Author:
Director’s Foreword
01
Message in a minute
The top line
The next big challenge for the higher education (HE) sector is not merely widening access, it is widening success. While there has been sustained interest in developing a value add measure for HE to understand how providers contribute to student success, previous attempts have failed to gain traction. Although progress measures based on prior attainment exist across compulsory and further education, there are practical and conceptual barriers which make this difficult for HE. Practical barriers include inadequate access to robust data on prior attainment, combined with a grading system in HE which lacks the necessary level of granularity to reliably assess progress from attainment at entry. The conceptual barriers are even more challenging, as the value society expects HE to add is qualitatively different from other phases of education. Value add for a sixth form or further education (FE) college means a learner achieving higher grades at L3 than would have been predicted based on their L2 qualifications. Value add for HE is more commonly defined as salaries many years after graduation. Correlating entry tariff into university with graduate salaries up to 5 years after graduation does not produce a meaningful instrument by which to judge the quality of teaching offered by any given provider.
What should be done
In developing a value add measure for HE, it is important to be clear what form of value is most useful, and how such a measure might be used to drive improvements across the sector which are actually useful for students, society and the economy. It is argued here that such a measure should focus on the extent to which outcomes for students entering HE are equitable. A provider that delivers better equality of outcomes for underrepresented students than the sector average is adding value via a reduced number of students dropping out of HE (often carrying debt which is unlikely to be repaid, and not leaving with qualifications that support career progression), and contributes towards levelling the playing field for students when entering the workforce. While there has been a longstanding policy focus on ensuring equality of access, the proposed Higher Education Value Add (HEVA) Index assesses the extent to which a provider is ensuring equality of outcomes for the students they have chosen to recruit. HEVA is a way of synthesising a large volume of benchmarked outcomes data into a single, easily interpretable indicator.
The bottom line
The HEVA Index is a flexible tool which can be adapted to explore equality of outcomes for a range of student groups, and can incorporate the full range of possible outcomes which are already regulated across the HE sector. The preliminary modelling of the index is based on the most recently published data from the OfS for English providers, and shows that the index recognises excellence across a wide range of provider types, including FE providers who offer HE qualifications. This modelling also shows that there is a large volume of providers for whom we currently cannot assess outcomes, due to a lack of public access to data. Further development of the methodology – given access to the required data – would allow the index to expand to include almost all providers, including those in Scotland, Wales and Northern Ireland.
02
Introduction
It is not unreasonable that any government or regulator of an education system should take an interest in ensuring that the system actively works to ensure pupils, learners and students make progress as they move from one stage to the next. Further, in a profession where continuous enhancement is an everyday expectation, identifying those institutions where pupil, learner or student progress tracks above the national average is a useful way of identifying good practice to drive system-wide improvement over time.
Across the English education system, the ways in which these ends are achieved are remarkably varied. When a child enters reception, within the first few weeks they will be assessed using the Reception Baseline Assessment (RBA) tool, which assesses each child’s baseline skills in numeracy, literacy, communication and language.1Standards and Testing Agency (2025) Reception baseline assessment framework, updated 1 April 2025. www.gov.uk/government/publications/reception-baseline-assessment-frameworkGo to note Throughout their reception year, children will then be more holistically assessed using the Early Years Foundation Stage Profile (EYFSP), allowing schools to support pupil transition from Reception/EYFS into the Key Stage 1 curriculum.2Department for Education (2025) Early years foundation stage profile handbook, updated 9 September 2025. www.gov.uk/government/publications/early-years-foundation-stage-profile-handbookGo to note At this stage, there is no formal sense in which schools are held accountable for progress or value add between RBA and EYFSP assessments. However, as children progress through primary education, the RBA assessment is compared with pupil performance at the end of Key Stage 2, to understand how much progress pupils have made.
Once a child enters secondary education, schools are subject to even greater scrutiny in terms of progress and value add, via the Progress 8 and Attainment 8 metrics.3Department for Education (2025) Secondary accountability measures (including Progress 8 and Attainment 8), updated 16 October 2025. www.gov.uk/government/publications/progress-8-school-performance-measureGo to note Progress 8, in particular, assesses GCSE outcomes for pupils based on their KS2 outcomes, compared with nationally comparable peers. A higher Progress 8 measure for a school means that pupils are achieving higher grades than their peers who had comparable KS2 outcomes.
Once entering further education (FE), there is far less uniformity in how we assess progress or value add. For learners undertaking A-levels or BTEC qualifications, there is a comparable value add measure to Progress 8, which compares grades achieved to prior attainment at GCSE, benchmarked to peers.4Department for Education (2026) 16 to 19 accountability measures: technical guidance, September 2026, p. 22. www.gov.uk/government/publications/16-to-19-accountability-headline-measures-technical-guideGo to note However, the relatively new T-levels have a separate accountability framework which does not align with this approach to measuring value add, and the same is true of intermediate and advanced apprenticeships, which also have their own accountability framework.5Department for Education (2026) Apprenticeship training provider accountability framework, updated 17 February 2026. www.gov.uk/government/publications/apprenticeship-training-provider-accountability-frameworkGo to note FE providers also serve a far more diverse community of learners, many of whom will be completing L1 and L2 qualifications, for which there is no systematic framework for measuring value add.
In recent years, discussion about value add in higher education has diverged even more sharply from the rest of our education system, with the concept of value add being almost synonymous with ‘graduate salaries’.6See, for example, Britton, J., Ogden, K., Ornadel, N. and Waltmann, B. (2026) New estimates of the impact of undergraduate degrees on lifetime earnings. Institute for Fiscal Studies research report for the Department for Education, June 2026.Go to note There are many reasons why this is the case, some of which are more rational than others.
From a political and broader public perspective, much of the focus on graduate earnings as the yardstick by which we decide if higher education has added value to a student’s life is driven by the fact that students are expected to make such a huge financial investment in order to access HE. Value add, in this sense, morphs into something more akin to return on investment. This is not wholly unreasonable in a narrow sense, but is a remarkably reductive lens through which to judge the value of an entire segment of our education sector.
It is important to recognise that for most students coming into HE, it is with the intention of moving into work as their next step (possibly via a postgraduate qualification, but still within the HE system). As such, it is not unreasonable that graduate outcomes should be at least one of the lenses through which we judge the impact of education (noting, also, that some of the accountability metrics used in FE do incorporate employment outcomes for learners who do not progress directly to HE – although such measures are not as central to FE regulation as they are in HE).
A further point of difference between HE metrics and all other parts of the education system relates to the contiguity of measurement with current educational practice. To illustrate this point, the Longitudinal Educational Outcomes (LEO) metric forms the backbone of national debate on the value/return on investment of higher education, showing the earnings of graduates 1, 3 and 5 years after graduating.7Department for Education (2025) Graduate labour market outcomes (LEO): tax year 2022-23, published 26 June 2025. explore-education-statistics.service.gov.uk/find-statistics/graduate-labour-market-outcomes-leo/2022-23Go to note However, these metrics are unavoidably lagged. Five year earning data seen in 25/26 are actually based on the 22/23 tax year, for students who graduated from their course in 2016/17, who would likely have begun their studies in September 2014. A course being offered in 2014 would have been written and validated no earlier than a year prior – taking us back to 2012/13. Students in 2012 would have been at the cutting edge of smartphone technology if they owned an iPhone 5, and Netflix had only just launched in January. They would also have to patiently wait four more years to exercise their democratic right to vote in the EU referendum. In other words, a lot can change in 14 years.
The point here is that while earnings data certainly tell us something about higher education in a broad sense, at a whole-system level over time, they cannot be used as a reliable proxy for the quality of education that is happening today. If a provider, today, has LEO metrics showing below average earnings 5 years after graduation, this can – at best – highlight concerns about course provision that was taught from 2014-2017. This tells us next to nothing about whether a course offered by this provider from 26/27 onwards is likely to offer a strong financial return on investment.
03
Progress towards a progress measure in higher education
Notwithstanding the complex issues associated with developing a value add measure for HE, as part of the Post-16 Skills White Paper, the Government has made the following commitment:
“We will work with the Office for Students to develop options for how we measure and compare progress in higher education. As Progress 8 has done in schools, a similar measure would hold providers to account not just for the outcomes their students achieve but also for the progress they make. It would offer providers across the whole sector sharper incentives to improve quality and outcomes, encouraging even those providers whose students have the highest attainment on entry to demonstrate progress, and enabling less selective providers to demonstrate the value they add.”8Department for Education, Department for Work and Pensions and Department for Science, Innovation and Technology (2025) Post-16 Education and Skills, CP 1412, October 2025, p. 67.Go to note
The UK higher education sector has invested significant efforts in attempting to develop a meaningful approach to assessing learning gain or value add, over a period of many years. One of the largest national projects, originally initiated by HEFCE, and reporting via the Office for Students in 2019, involved a £4m investment in 13 pilots to develop approaches to assessing learning gain.9Kandiko Howson, C.B. (2019) Final evaluation of the Office for Students learning gain pilot projects. Office for Students, July 2019.Go to note While these projects generated important insights, they fell short of delivering a standardised approach to measuring learning gain in HE. Importantly, this focus on learning gain as a means of assessing value add very clearly indicates that the value that is important is educational, not financial.
In the most recent Teaching Excellence and Student Outcomes Framework (TEF) exercise, providers were invited to provide evidence of their approach to learning gain. However, the OfS stopped short of providing clear guidance on how this could be evidenced, and instead left it for individual providers to demonstrate their own approach and methods for evaluating impact.10Office for Students (2022) Regulatory advice 22: Guidance on the Teaching Excellence Framework 2023, October 2022.Go to note This generated a significant amount of further insight into the different ways in which learning gain and value add are conceptualised across the sector. In an analysis for the OfS, Fung provided a useful breakdown of the ways in which such measures were constructed, based on a review of 51 Gold-rated provider TEF submissions.11Fung, D. (2024) Educational gains explored: independent report on higher education providers’ approaches to educational gains in the Teaching Excellence Framework (TEF) 2023. Report to the Office for Students, March 2024.Go to note These were broken down into the level at which gains were assessed, and the type of gains which were prioritised, as follows:
Level of gain
- Individual benefits for students through their acquisition of knowledge, skills and attributes.
- Collective benefits for society; in this dimension, educational gains are seen as social and community goods, contributing to goals such as social mobility, sustainability, social cohesion and social justice.
Type of benefit
- Comprehensive gains are those which all students are expected to achieve; for example, this might be a set of commonly expected learning outcomes or ‘graduate attributes’.
- Targeted gains are expressed in terms of those shaped for a particular type of student, for example those who are the first in their family to access higher education, or mature students who are learning at a distance.
- Personalised gains are those adapted for each student; they are defined and developed through individualised engagements, for example through personal tutorial support. Many providers also highlight the importance of both disciplinary-based and interdisciplinary gains, articulating the benefits of each.12Fung (2024), pp. 2–3.Go to note
While this is a useful typology, it reinforces an important observation: there is no commonly accepted or applied approach to assessing the value add from higher education. Indeed, before even attempting to develop such a measure, one must first define the fundamental nature of what gain or value we think is important.
If the analysis of TEF submissions represents a bottom-up understanding of the value added by HE, a top-down model does already exist in the form of the OfS’s assessment of the B3 conditions of registration for English HE providers.13Office for Students (2022) Regulatory advice 20: Regulating student outcomes, July 2022, updated October 2023.Go to note
The regulatory framework for B3 metrics assesses the performance of providers with regard to student outcomes, which are benchmarked based on overall sector performance for matched groups of students. This means that providers are given benchmark targets for a range of student outcomes, against which their actual performance is judged. Where a provider has student outcomes which are above their benchmark, this is an indication that the provider is ensuring outcomes for their students which are better than the outcomes delivered for similar students across the rest of the sector. In other words, above benchmark performance on B3 is a method of demonstrating value add.
Figures 1a and 1b, below, illustrate how these benchmarks are presented for student outcomes and student experience. In this example on student outcomes, the provider is performing below benchmark for continuation, but in line with benchmark for completion and progression (i.e., graduate outcomes). On student experience, the provider is performing above benchmark for some aspects of the NSS, and in line with benchmark for others.
Figure 1a. Provider-level metrics for Student Outcomes against benchmark
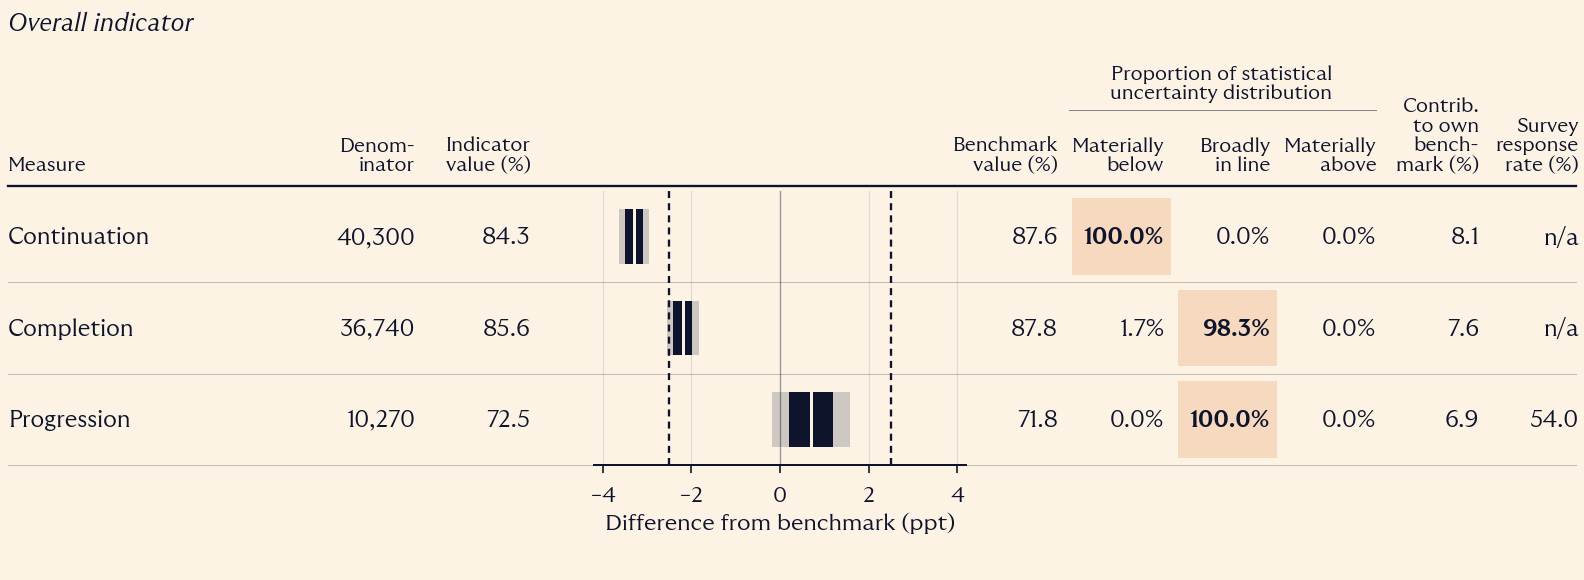
Figure 1b. Provider-level metrics for Student Experience against benchmark
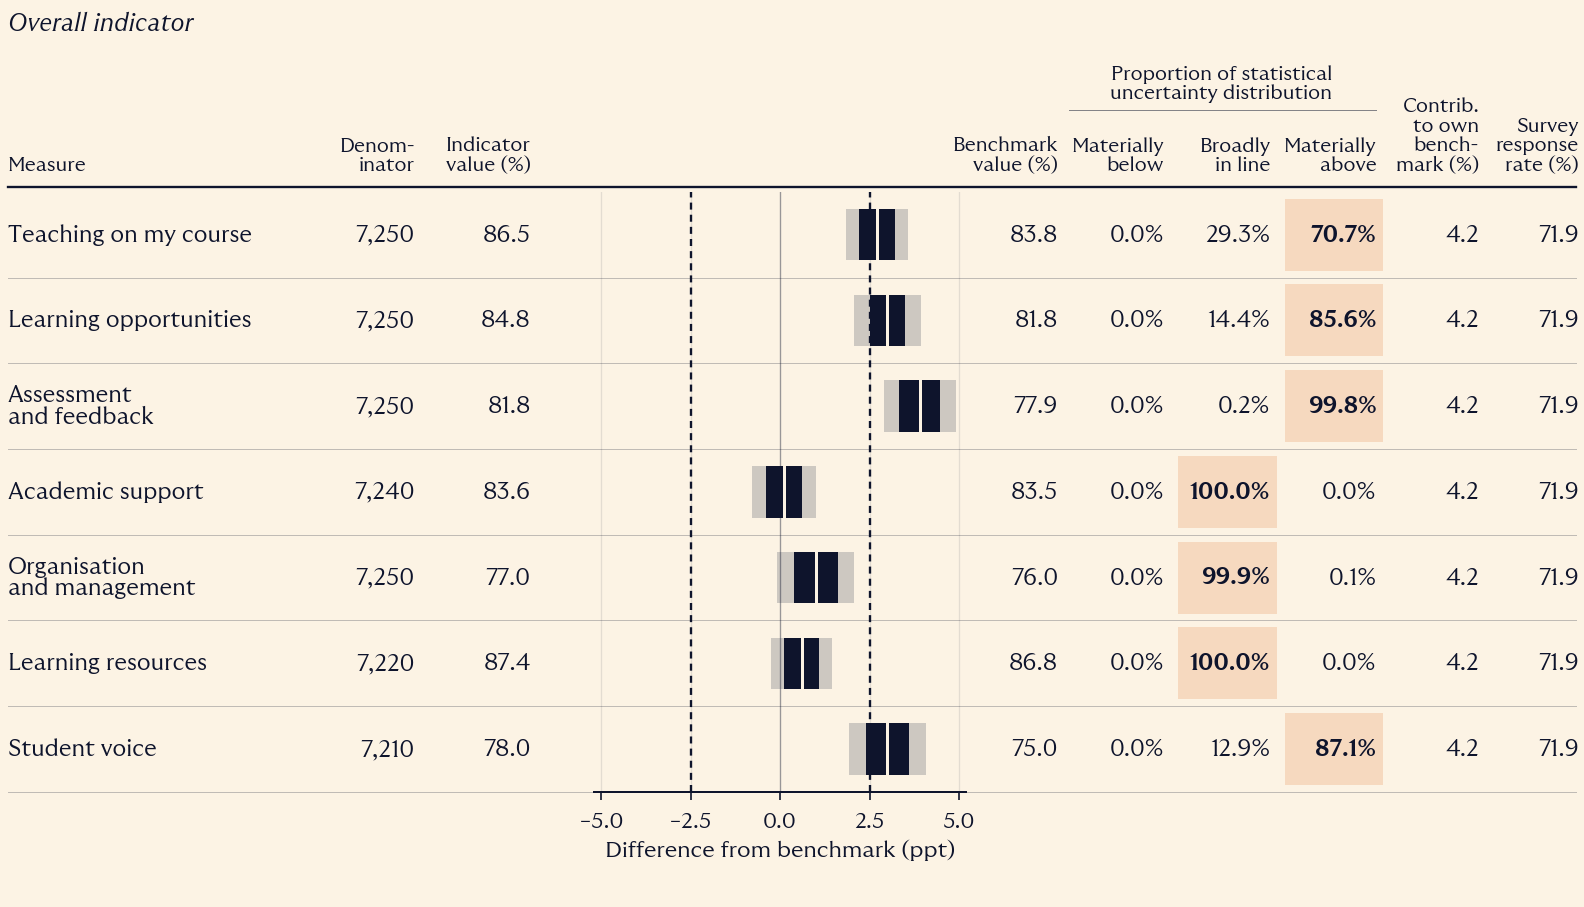
Source: Office for Students student outcomes and student experience data dashboards, redrawn by The Post-18 Project; the shaded uncertainty ranges are indicative.
One challenge with using these metrics to form a whole-sector approach to measuring value add is that they are extremely detailed. The examples, above, show metrics for the whole provider. But each metric is also broken down across a large number of splits – by student characteristic, study mode, and subject. This makes it difficult to compare providers with one another, as the metrics have far too many dimensions against which performance could be compared.
Where does this leave us? Seemingly, in complicated territory. We have plenty of data, and many ways of cutting and looking at it. We also have a range of ways in which we might choose to define value add at a conceptual level – many of which are already actively embedded within individual providers who pinned their colours to the mast on this issue in their most recent TEF submission.
There remains one further complexity, which has so far only been alluded to indirectly – whether value add can actually be framed in the context of prior educational attainment in the HE sector.
04
Does value add only ever mean beating your past best?
The Post-16 Skills White Paper proposes the development of a value add index for HE which is comparable to the Progress 8 metric used in secondary education. However, there is a specific feature of Progress 8 which is not obviously compatible with our higher education system – the use of prior attainment as a starting point for defining value add. Intuitively, judging value add in this way does make sense: the idea that value add means helping a student to do better than they might have expected based on prior attainment feels meaningful, and aspirational. However, there are practical, structural, and fundamental conceptual issues with this framing in our higher education context.
On a practical level, it is a feature and not a flaw of our higher education system that entry tariff is not the sole determinant of offer making. Many providers specialise in offering opportunities to students from non-traditional backgrounds, who may not have L3 qualifications, but have extensive work and industry experience which sets them up to succeed. Specialist providers and conservatoires often have very rigorous selection processes for prospective students, including interviews, performances and assessment of their suitability for a course which extends far beyond L3 grades and credits. It is by design that our higher education system is far more complex than the compulsory education system in terms of the assumptions we make about what prospective students will have done, and need to have achieved, prior to arrival.
Our HE system is also, in an explicit and intentional structural sense, organised around an overt and intentional principle of selectivity linked to prior educational attainment. Indeed, this is so deeply ingrained that, in the case of English providers, the OfS explicitly categorises providers as being high, medium or low/unknown entry tariff.14Office for Students (2022) Provider typologies 2022: Methodology for grouping OfS-registered providers, November 2022.Go to note This presents a methodological challenge for developing a meaningful, whole-sector value add metric, if this is linked to prior attainment.
To illustrate this point, we can use the example of degree attainment in HE. Because the majority of undergraduate programmes give awards across a narrow range of first- to third-class classifications, providers recruiting high entry tariff students would experience a ceiling effect in calculating value add on the basis of prior attainment. If the majority of students are entering such a provider with very high prior attainment, a first or a 2:1 outcome would not obviously represent value add, but would simply reflect students continuing on their pre-existing trajectory. This would not mean that the provider delivered poor quality education, only that they could not meaningfully be said to have added significant additional value in terms of educational outcomes – if ‘value’ is narrowly defined as the overall attainment of students.
On the other hand, providers recruiting students with low or unknown tariff (perhaps leaning heavily on contextual admissions practices), would have a very strong advantage in a system where prior attainment is the key determinant of value add calculations, if a methodology similar to Progress 8 were deployed. The distorting effect of providers having, often, very deeply embedded expectations of prior attainment would render a value-add metric which uses prior attainment as its core feature meaningless for higher education.
If one accepts these arguments against the use of prior attainment as a measure of value add in higher education, how else can this be achieved? We have – over several decades – encouraged HE providers to work on improving fair access to HE. At the same time, through its (increasingly) complex regulatory framework, the OfS has also made clear that providers are accountable for ensuring they can deliver positive outcomes for whoever they choose to recruit. While there has been huge progress on improving overall access to higher education, there is a less positive story to tell on the extent to which we have been eliminating inequalities of outcome.15Department for Education (2026) Widening participation in higher education: 2024-25, published 9 July 2026, explore-education-statistics.service.gov.uk/find-statistics/widening-participation-in-higher-education/2024-25; Office for Students, Access and participation data dashboard, updated February 2026, www.officeforstudents.org.uk/data-and-analysis/access-and-participation-data-dashboardGo to note This is the starting point for developing a meaningful measure of value add for HE.
05
HEVA: the Higher Education Value Add Index
The proposal developed here attempts to address the aforementioned challenges associated with varied definitions of value add across the HE sector; structurally determined variations in the profile of prior attainment of students at whole-provider level; and the complexities associated with the wide range of candidate metrics which might be used to assess value add in a consistent way across the sector.
The Higher Education Value Add (HEVA) Index is based on the assumption that delivering equality of outcomes for students who enter HE from disadvantaged backgrounds is a meaningful form of value for the sector to add. HEVA compares a provider’s student outcomes – Continuation, Completion and Attainment – to the sector average in a given year. The index therefore recognises providers who are doing more to contribute to a reduction in overall equality of outcome gaps across the student lifecycle, and those who are lagging behind the sector.
Equality of outcomes in this context does not, of course, mean that all students should be achieving the same outcome. There are many factors which will impact on educational outcomes, including talent and aptitude for a subject, or the amount of effort put into your studies. Differential outcomes which correlate with these factors reflect the education system doing what it is designed to do. Inequalities of outcome which are demarcated strongly by factors such as receipt of free school meals, ethnicity, gender, family income, or your home postcode do not reflect a well-functioning education system, but a system which is perpetuating (or, at the very least, failing to mitigate) entrenched disadvantage.
What does this mean in terms of the typology articulated in Fung’s analysis of approaches to defining educational gain?16Fung (2024).Go to note In terms of the level of value add, this approach is both individual and collective in focus. The index addresses individual-level outcomes by utilising student characteristics which are known to predict educational inequality across the entire education system. However, this is also a collective approach, in the sense that the index prioritises and values the reduction of educational inequality as an important aim for the whole sector.
The approach also takes a Targeted approach to the delivery of Comprehensive gains, in the sense that pre-existing inequalities are prioritised for certain groups, with the focus of outcomes being linked to multiple metrics – continuation, completion and attainment – which represent different stages of a student’s journey through HE.
06
Methodology
The HEVA index is based on a comparison of outcomes for a specific group of students, at the level of individual providers, and compared with the current gap in outcomes for FSM students at a national level. For illustrative purposes, being in receipt of free school meals (FSM) is used in this report, as this is a widely understood student characteristic which is consistently associated with educational inequality across all phases of the education system.17Education Policy Institute (2026) Annual Report 2026, July 2026. epi.org.uk/annual-report-2026Go to note
A HEVA value of 1 means a provider has a gap in FSM student outcomes which is equal to the current sector gap. HEVA values above 1 mean that a provider has a smaller gap than the sector average, and values below 1 would reflect a gap which is larger than the national average.
Because this index is based on the overall outcomes for FSM and non-FSM students at provider level, and not weighted by student numbers, the index is therefore insensitive to differences in the number of FSM students at a given provider. Whether or not a provider ought to be aiming to recruit more students from FSM backgrounds is a matter for other parts of our regulatory system.
An important design feature of the index is that the outcomes of FSM students are compared with non-FSM on a cumulative basis across the student lifecycle, from continuation through to completion and attainment. Under the current OfS model for providers in England, student outcomes at each stage of the student lifecycle are not assessed cumulatively. This means that measures of completion, attainment and progression are not sensitive to provider-level differences in drop-out rates via non-continuation. In other words, a provider could have a very high rate of non-continuation for a specific group of students, but their attainment rates are only based on those students who successfully completed their qualification – with non-continuing students ignored in the calculation of attainment gaps.
While this approach may seem intuitively appealing to avoid double counting negative outcomes at each stage, in reality the approach is not aligned with modern evaluation methodologies used in a range of other fields. Assessing provider performance on student outcomes using a cumulative approach is consistent with so-called ‘intention to treat’ analyses used in the evaluation of complex interventions.18Gupta, S.K. (2011) ‘Intention-to-treat concept: a review’, Perspectives in Clinical Research, 2(3), pp. 109–112.Go to note The rationale for this approach is that a failure to engage with a treatment or intervention is functionally equivalent to engaging and not experiencing a positive treatment effect. Discounting early drop-outs can inflate treatment effects, because it treats early drop-out as if this is entirely the fault of the individual, not the treatment or intervention itself.
In an educational context, taking an intention to treat approach to assessing student outcomes ensures that a measure of value add recognises providers who retain more students throughout the student lifecycle, contrasted with those who may have artificially inflated attainment outcomes due to very high rates of early dropout of students from certain backgrounds.
Box 1. HEVA key design features
- HEVA compares a provider’s performance to the whole sector average each year. The sector value is always 1, such that providers with values above 1 are delivering greater equality of outcome, and those with values below 1 are performing below the sector average.
- The initial modelling of the index is based on differences in outcomes for free school meal entrants, as this is a commonly recognised student characteristic associated with inequalities of outcome at all other phases of the education system. However, the design of the index allows other student characteristics to be used in place of FSM.
- The index utilises publicly available regulatory metrics for English HE providers – Continuation, Completion and Attainment. Progression could be added into a future iteration, but for the present purposes of modelling, this excludes a larger number of providers based on very limited availability of public data. Similarly, the methodology could be applied to L4 and L5 qualifications, for which Progression and Attainment measures are not currently applied, utilising only Continuation and Completion metrics.
- The index is currently applied to English providers, but could be extended to include all providers in the United Kingdom. The decision to focus on English providers here is due to the fact that the OfS publish far more granular student outcome metrics; but these data do exist in Scotland, Wales and Northern Ireland and could be incorporated.
- Access metrics are explicitly excluded for HEVA, as equality of access is already regulated in other ways. Importantly, this also means that a provider is being judged based on the students they have chosen to recruit – a provider recruiting a relatively small number of FSM students but ensuring equality of outcomes compared to non-FSM students will score highly in this index.
- Unlike existing regulatory measures of inequalities of outcome, HEVA is a cumulative metric. This means that providers who have small gaps in degree attainment, but have large gaps earlier in the student lifecycle (e.g., high rate of non-continuation of FSM students) will have a lower index value. The highest index values can only be achieved by ensuring equity in continuation, completion and attainment – not just one of these metrics.
- The HEVA index is not intended as a regulatory metric which detects the presence or absence of educational excellence. Rather, it presents a starting point for individual providers to understand their own position in relation to the wider sector, in terms of the extent to which the outcomes for their students are equitable across the whole student lifecycle.
Tables 1 and 2, below, illustrate the way in which HEVA would be calculated for a set of hypothetical providers, based on attainment outcomes. These two tables are shown side by side, to illustrate the distorting effect (Table 1) of a non-cumulative approach to assessing outcomes. Table 2, on the other hand, shows how a cumulative, intention to treat approach to assessing outcomes recognises providers who retain more FSM students through to attainment of their award, while reducing the index value for those who lose more students earlier in the student lifecycle.
Table 1. Non-Cumulative Modelling of HEVA
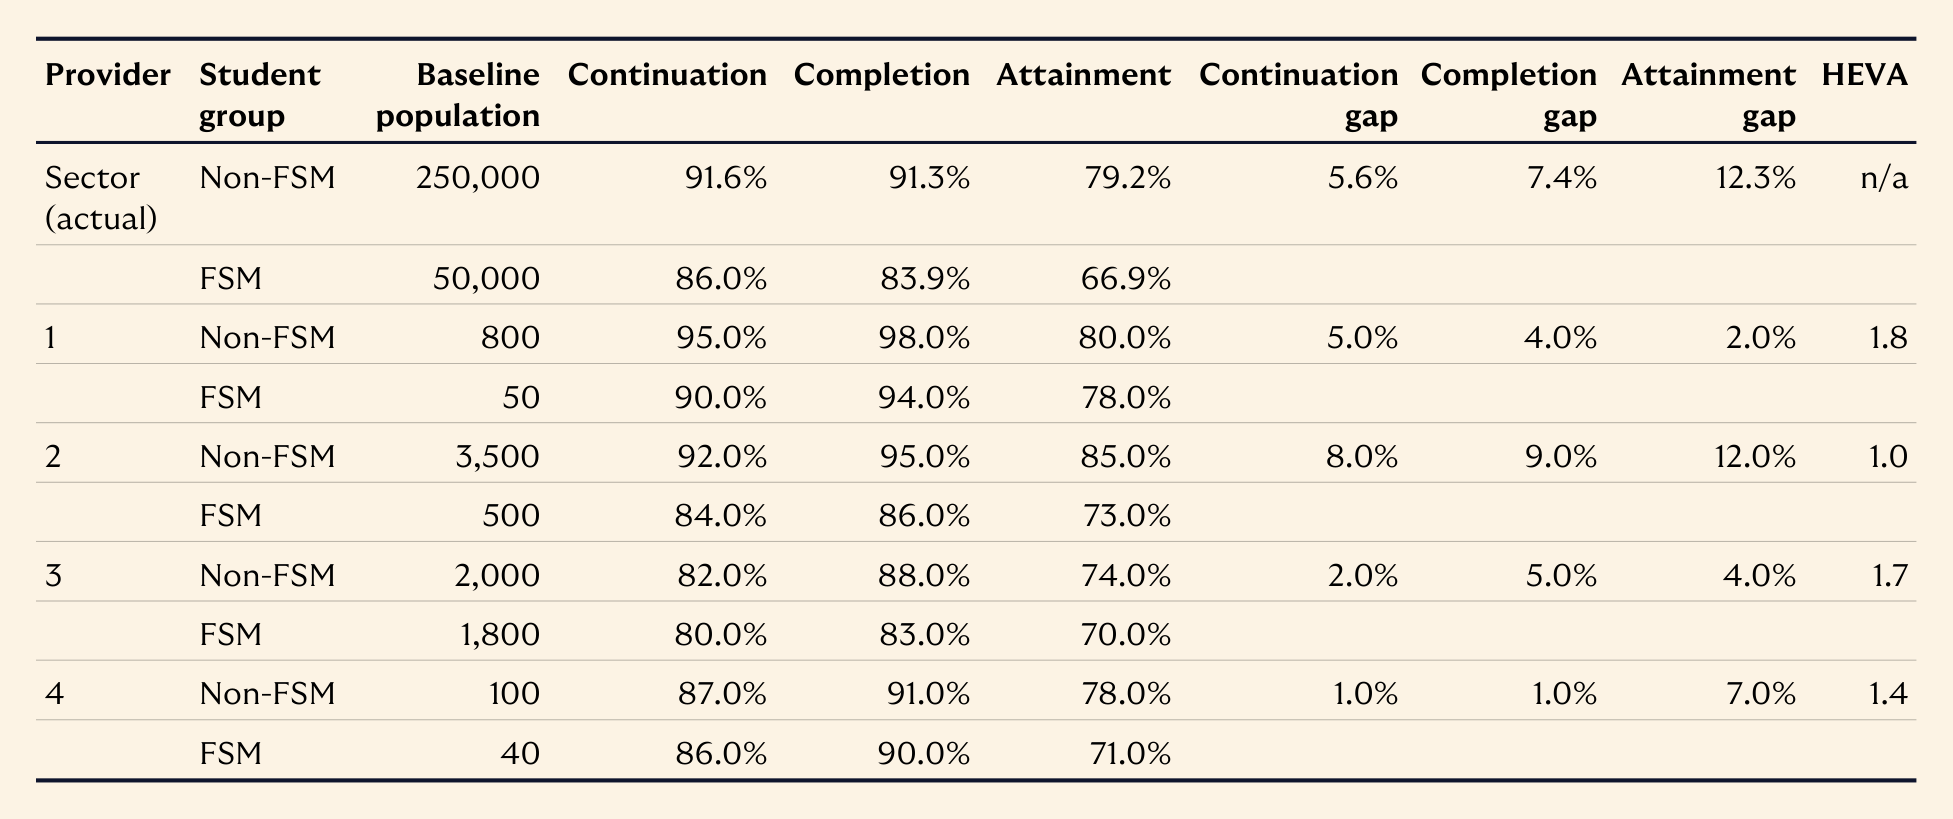
Table 2. Cumulative Modelling of HEVA
In this analysis, it is clear that cumulative modelling provides a more meaningful assessment of the performance of different providers. In the non-cumulative model, all four providers have attainment gaps which are equal to or less than the sector average, meaning HEVA index scores are all 1 or more. However, in the cumulative model, the underlying differences between providers in terms of the gaps in continuation and completion impact on the final index.
Comparing providers 3 and 4, under non-cumulative modelling, it would appear that provider 3 is delivering greater value add for FSM students. However, when taking into account that Provider 4 actually has a lower gap for FSM students on completion and continuation, this balances out and both provider 3 and 4 have the same high HEVA index of 1.6. Importantly, these two providers are very different in terms of FSM student numbers, but this does not impact their ability to achieve similar positive scores. They are each contributing above the sector average on reducing inequality, but they are achieving this in slightly different ways. Provider 4 has a stronger story in relation to ensuring equality of retention of students to completion of their course, but Provider 3 has stronger performance in relation to equality of attainment rates – and these different strengths balance out in the final analysis.
In the case of Provider 2, when using non-cumulative modelling, due to the provider’s attainment gap being equivalent to the sector, the HEVA index is 1. However, this masks the fact that this provider has higher than average continuation and completion gaps, and when these are incorporated under a cumulative model, the provider’s HEVA index drops to 0.8. This is important as it reflects the fact that the provider has a much higher rate of drop out for FSM students compared to non-FSM students, and so contributes negatively to the sector average.
07
Modelling the HEVA Index
Based on the most recently available OfS access and participation data, the HEVA index has been calculated for all providers in England. This modelling provides a number of interesting insights into how the proposed index operates.
Box 2. Technical specification for HEVA
- Modelling is based on a baseline population of 205,470 non-FSM and 43,370 FSM students (248,840 in total), which is the whole sector 22/23 full-time undergraduate Continuation population published by the OfS in its access and participation data.19Office for Students (2025) Access and participation data dashboard: data resources, 2025 release, sector-level data (full-time, all undergraduates, by free school meal eligibility). www.officeforstudents.org.uk/data-and-analysis/access-and-participation-data-dashboard/about-the-data-dashboard/get-the-dataGo to note
- For each provider, and the whole sector, a cumulative version of Completion and Attainment is computed, based on 22/23 Continuation rates. This is achieved by multiplying the rates through the student lifecycle: Cumulative Completion is the Continuation rate multiplied by the Completion rate, and Cumulative Attainment is Cumulative Completion multiplied by the Attainment rate – so that non-continuing students count as non-completers, and non-completers as not attaining.
- HEVA Index scores are a standardised figure based on the cumulative attainment gap, using the whole-sector gap as the baseline, as follows:
HEVA = 1 + (Sector Cumulative Attainment Gap − Provider Cumulative Attainment Gap) / Sector Cumulative Attainment Gap
- HEVA is therefore a linear index centred on the sector. A value of 1 means a provider’s cumulative attainment gap equals the sector’s; 1.5 means its gap is half the sector’s; 2 means no gap at all; and values above 2 mean FSM students out-attain their non-FSM peers. Below 1, a value of 0.5 means a gap one and a half times the sector’s, and 0 means a gap twice the sector’s. The index can in principle fall below zero, though no provider in the current modelling does.
- This methodology can be refined with access to underlying datasets, allowing cohort tracking over time, which would ensure that the cumulative completion and attainment figures reflect students who have interrupted or repeated years – this is not possible based on the publicly available datasets meaning the current modelling should be taken as illustrative and not definitive.
The first key observation is that, out of 346 registered providers, only 87 have sufficiently complete data on FSM student outcomes to enable an index to be calculated. Missing data exists for a number of reasons – chief of which would be that a provider has too few FSM or non-FSM students (<23), which causes data to be suppressed for data protection reasons.
Of the 87 providers who do have complete datasets in the public domain, these account for 73% (149,700) of all non-FSM students in the base sample, and 76% (32,940) of all FSM students. This means a minority of providers are providing access to the majority of FSM students.
A second observation is that, of the 87 providers with a computed HEVA index, 75 (86%) have an index above 1 – meaning that they are performing better than the sector average in terms of outcome gaps for FSM students. This is particularly interesting, given that this group also accounts for the majority of FSM students in the base sample. The implication is that those providers without an index score must – in aggregate – have wider gaps than the sector average. Stated another way, a small proportion of all registered HE providers (22%, 75 out of 346) are recruiting the majority of FSM students, and they are having a disproportionately positive impact on reducing inequalities of outcome for this group.
To explore this observation further, Table 3 illustrates the continuation, completion and attainment gap for the whole sector, compared with the 87 providers for whom the HEVA index is calculated. At each stage, the gap for these 87 providers is lower than the sector average – in the case of attainment, by 4.1 percentage points.
Table 3. FSM student outcome gaps for sector and HEVA index providers
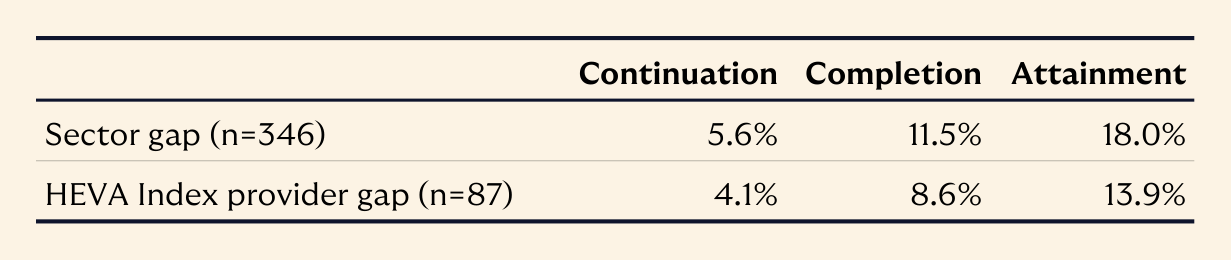
(Note: completion and attainment gaps are cumulative values weighted by gaps at the prior stage of the student lifecycle)
A third, critical, consideration is whether the index is particularly biased towards specific provider types or regions. As discussed previously, one of the challenges with a value add metric based primarily on prior attainment is the risk of ceiling effects for high entry tariff providers, and floor effects for low entry tariff providers.
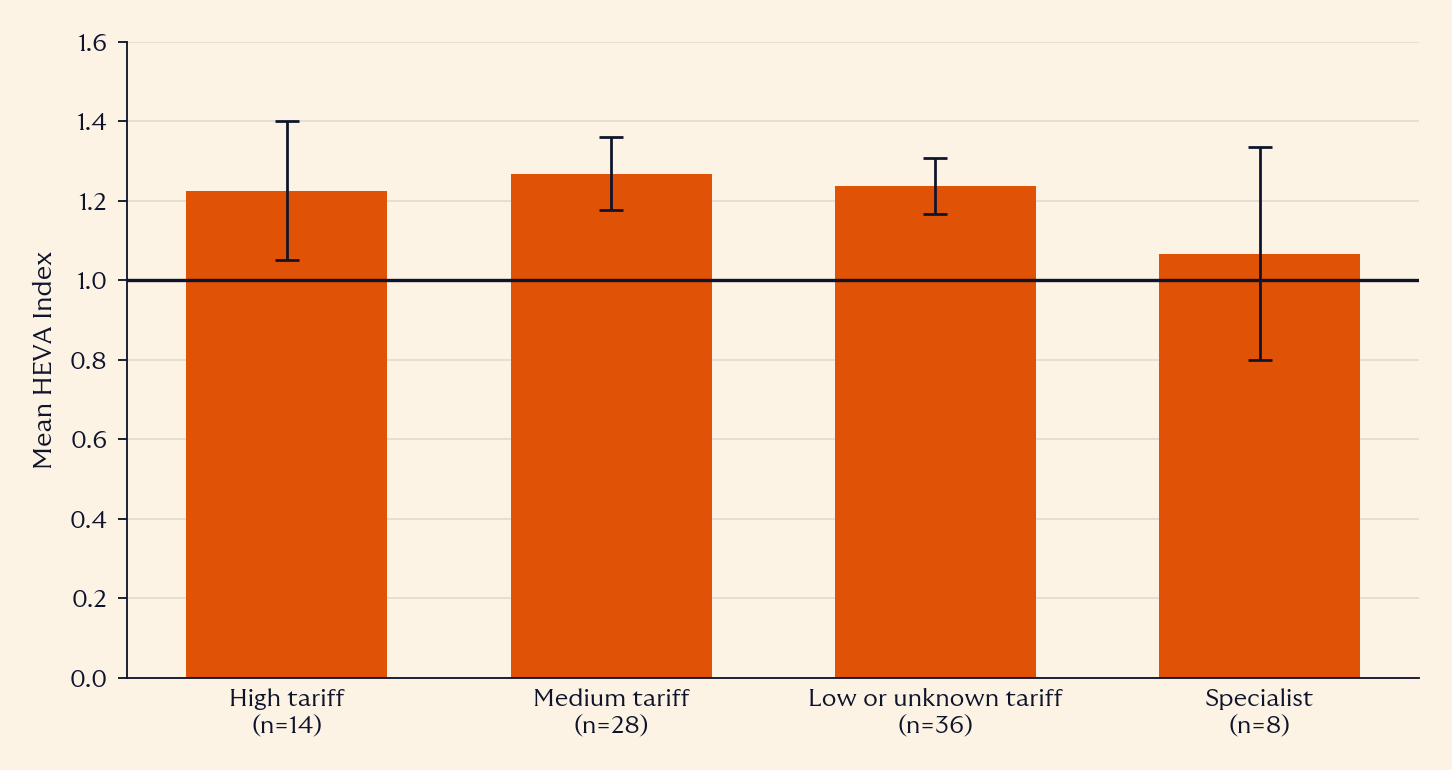
As shown in Figure 2, there is no clear difference in this initial modelling between the HEVA index scores for different provider types – and as can be seen from the provider-level data, all provider types are represented amongst the highest scoring 25 providers. The same is true for the 12 providers with index values below the sector average. Similarly, there is no clear pattern in HEVA index values when comparing providers by region – as illustrated in Figure 3.
Figure 2. Average HEVA Index values by provider type.
Figure 3. Average HEVA Index values by region.
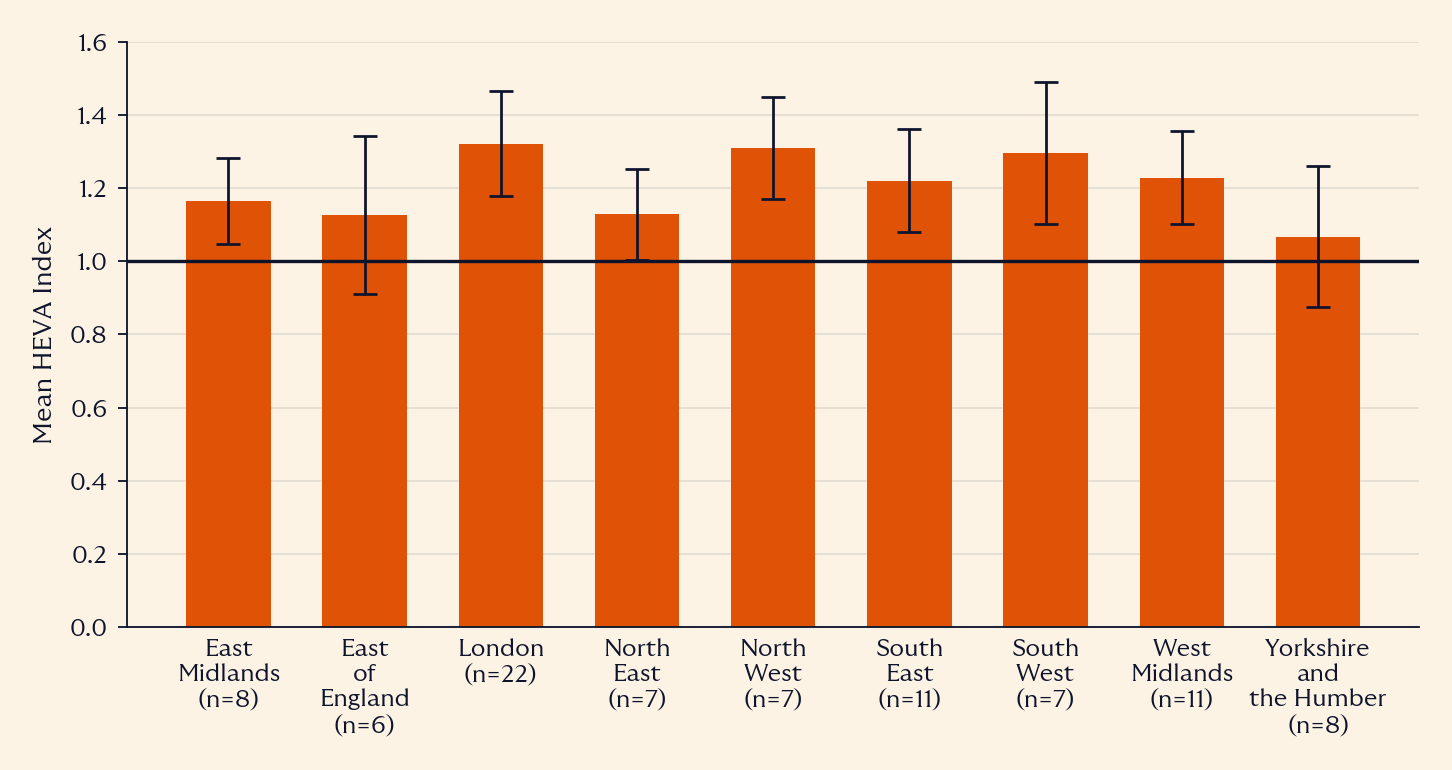
Error bars in Figures 2 and 3 show plus or minus two standard errors of the mean.
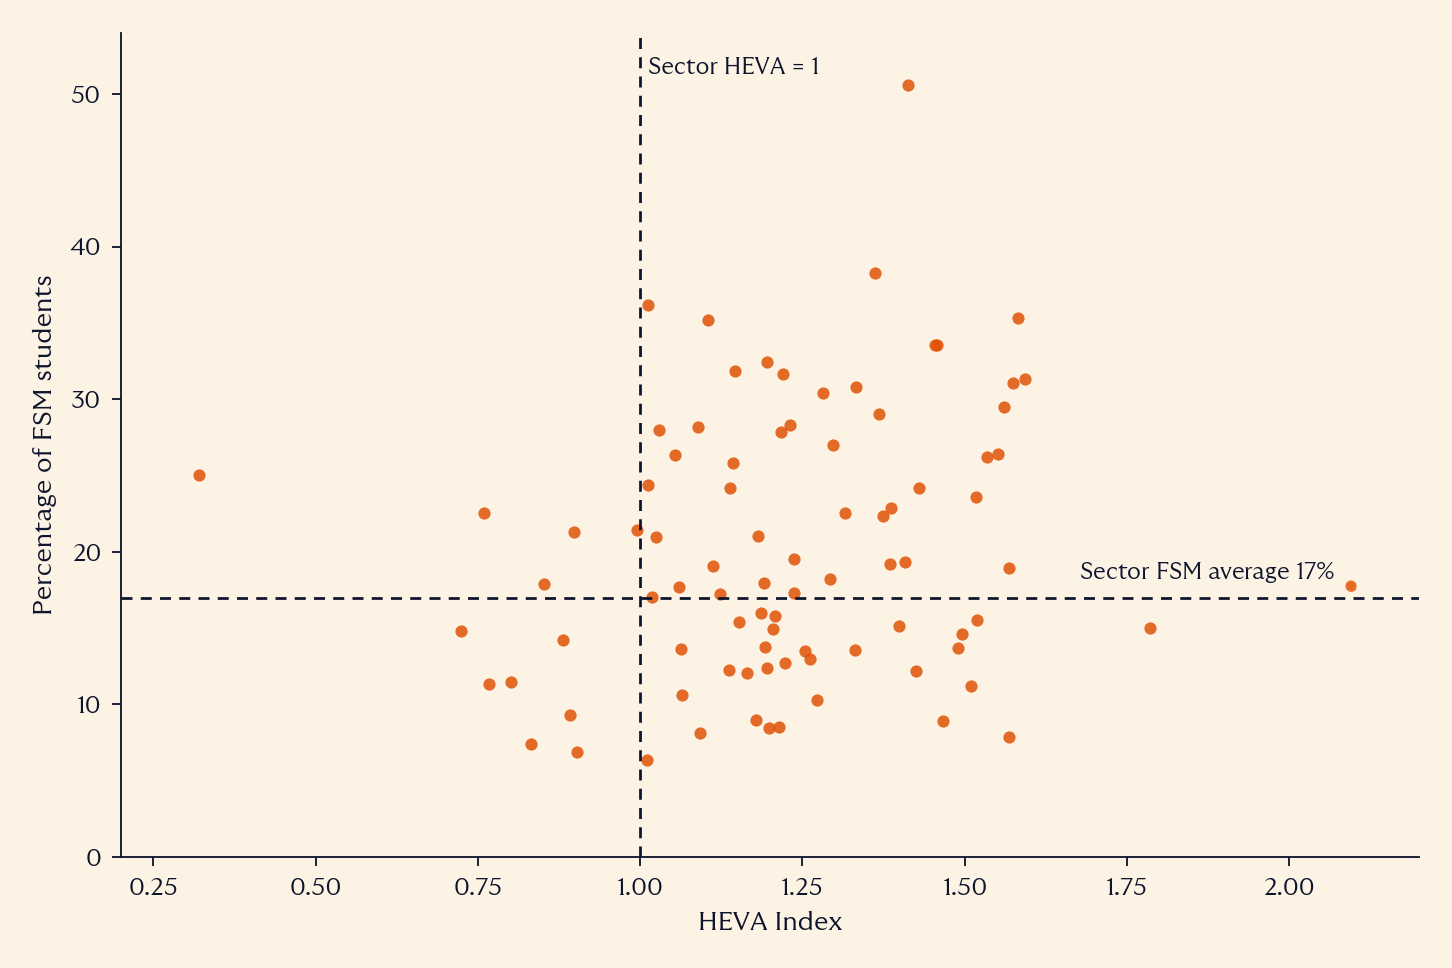
Reinforcing the observation that the HEVA index does not simply operate as a metric which values high levels of recruitment of students from FSM backgrounds, Figure 4 plots the distribution of HEVA scores for all providers in the model against the percentage of FSM students recruited into each provider. The four quadrants in the chart are demarcated by HEVA scores above and below the sector average, and the FSM percentage either side of the sector average of 17%. Notwithstanding the earlier observation that this group of providers are predominantly doing better than sector average, it is clear there is almost no correlation between FSM student percentage and HEVA index. In other words, providers who recruit relatively few FSM students are just as able to score highly in the index as those who recruit more – and vice versa.
Figure 4. Provider level FSM recruitment and HEVA index.
08
Conclusion and recommendations
It is important to be clear about the purpose of any value add metric developed for the HE sector, and to consider the behaviours it is intended to drive and reward. The proposed HEVA Index explicitly prioritises the reduction of gaps in outcomes between different student groups across the whole student lifecycle – not just at the end. The initial model has focused on FSM students. This is in large part because FSM status is widely recognised across the education sector as a reliable predictor of educational inequity. It is entirely possible to amend the model presented here to use different student characteristics – including metrics which attempt to aggregate multiple markers of disadvantage such as UCAS’s Multiple Equality Measure,20UCAS (2018) MEM – summary report. UCAS Analysis and Insights, October 2018.Go to note or the OfS’s Associations Between Characteristics of Students quintiles.21Office for Students (2022) Associations between characteristics of students, updated 30 September 2022. www.officeforstudents.org.uk/data-and-analysis/associations-between-characteristics-of-studentsGo to note
The proposed index could no doubt be further refined and adjusted. One of the key limitations here is the absence of data for a large proportion of providers where data is suppressed at provider level. For England, the OfS should compute index values for individual providers, without having to make underlying metrics publicly available where data protection is a concern. Preferably, working with Medr, the Scottish Funding Council and the Department for the Economy, the OfS and its national counterparts would be able to develop a version of this index which provides a clear picture across the whole UK. This would improve the utility of this approach, and allow us to understand more about the areas where inequalities of outcome are the most significant across our sector.
So what does HEVA tell us, and what does it not say?
Like any metric looked at in isolation, an institution’s HEVA Index tells us nothing about the quality of what happens in that provider’s classrooms, lecture halls and labs. It cannot be used as a proxy for judging the quality of support students are offered through application, enrolment, induction, as they transition through their course, or once they leave to take their next steps in life. What it does tell an individual provider is how they are benchmarking against the rest of the sector in delivering equitable outcomes for the community of students they have chosen to serve.
A high value in the index is not cause for complacency – if the sector improves and a provider remains static, their index score will drop. Correspondingly, a low value in the index is not an immediate marker of poor quality – but it should be a trigger for asking questions about when and why certain students are succeeding less frequently. The process of diagnosis here is critical. For one provider, there may be a very early challenge associated with high levels of dropouts of FSM (or other) students in the first few weeks of teaching. This may speak to the need for better transition support. Perhaps for another provider, early transition support seems to work well, but problems start later in the cycle, with more FSM students attempting but academically failing modules in the second year and not making it to the final year of their degree. This might prompt reflection on teaching and assessment approaches, and how well all students are being supported in L4 to succeed once they reach L5. And so on.
It is also very interesting to see that 75 providers out of 346 (22%) have a HEVA index above 1, and perform better than the sector average. This small group also enrols 70% of all FSM students in the sector. This suggests a very uneven distribution of outcomes, which HEVA can highlight but not explain – and is something we should collectively be keen to urgently understand.
Why do we need HEVA now?
The debate about value in higher education has become increasingly dominated by questions of graduate earnings and return on investment. Yet higher education delivers value in many ways, not least through its capacity to reduce social inequalities and expand opportunity. If policymakers wish to develop a meaningful higher education analogue to Progress 8, the objective should not be to recreate a school accountability measure within a fundamentally different educational context. Instead, the aim should be to recognise providers that deliver more equitable outcomes for the students they serve, and incentivise all providers to keep moving the collective dial.
HEVA represents one possible approach. It is not a measure of teaching excellence, nor a replacement for existing regulation. It represents a simple but powerful proposition: institutions add value when they narrow outcome gaps. HEVA allows us to see where widening access is leading on to widening success, and wherever we see that golden thread, we can be confident that we are adding genuine value.
09
Review the data
The full provider data set behind this paper is available to download as an Excel workbook or as a CSV file, and you can look up any English provider’s index – or see exactly which figure is missing – at Find your provider.